
How to A/B Test Printed Flyers with Two QR Codes
Learn how to split a print run and use two different QR codes to compare offer types or landing pages. This guide covers testing methodology, sample sizes, and data analysis.

How to Split Your Print Run for A/B Testing
A split test requires a balanced distribution of your printed materials. You should divide your total print run into two equal halves. For example, if you produce 500 flyers, create two distinct QR codes that point to the same destination but use different tracking identifiers. Use one code for 250 flyers and the other for 250 flyers. This ensures that each variation is tested against an equal number of potential scanners.
What to Keep Constant Between the Two Codes
A/B testing on physical media requires strict control over variables. If you change more than one thing at a time, you cannot know which factor drove the scan. For example, if one flyer features a blue button and another features a red button, a difference in color choice will skew your results. To isolate the effect of the QR code's destination, you must keep every other visual element identical. Use the same font, imagery, and layout for both versions. The goal is to have two nearly identical flyers where only the specific offer or landing page link differs. This ensures that any difference in scan volume between the two codes is caused by the specific content of the searcher. By keeping the design constant, you create a fair test. You can then look at which destination provides more conversions or higher engagement. If one code performs better, you have clear evidence to find your next marketing strategy.
Determining Sample Size and Duration
A small sample size makes it hard to tell if a winner exists. If you only have ten scans on each flyer version, one lucky click could skew your data. You need enough volume to see a clear pattern before making a decision. Decide on a target number of scans for each code before you start. This prevents you from jumping to conclusions based on early results. Wait until both codes reach a specific threshold, such as 100 scans, before comparing the performance of your marketing materials. Timing is just as important as volume. A flyer might perform well during as planned promotion period, but it may fail in a different location or at a different time. Run your test for a set amount of time to ensure you collect enough data from various locations and times.
Tracking Scan Data with Dynamic QR Codes
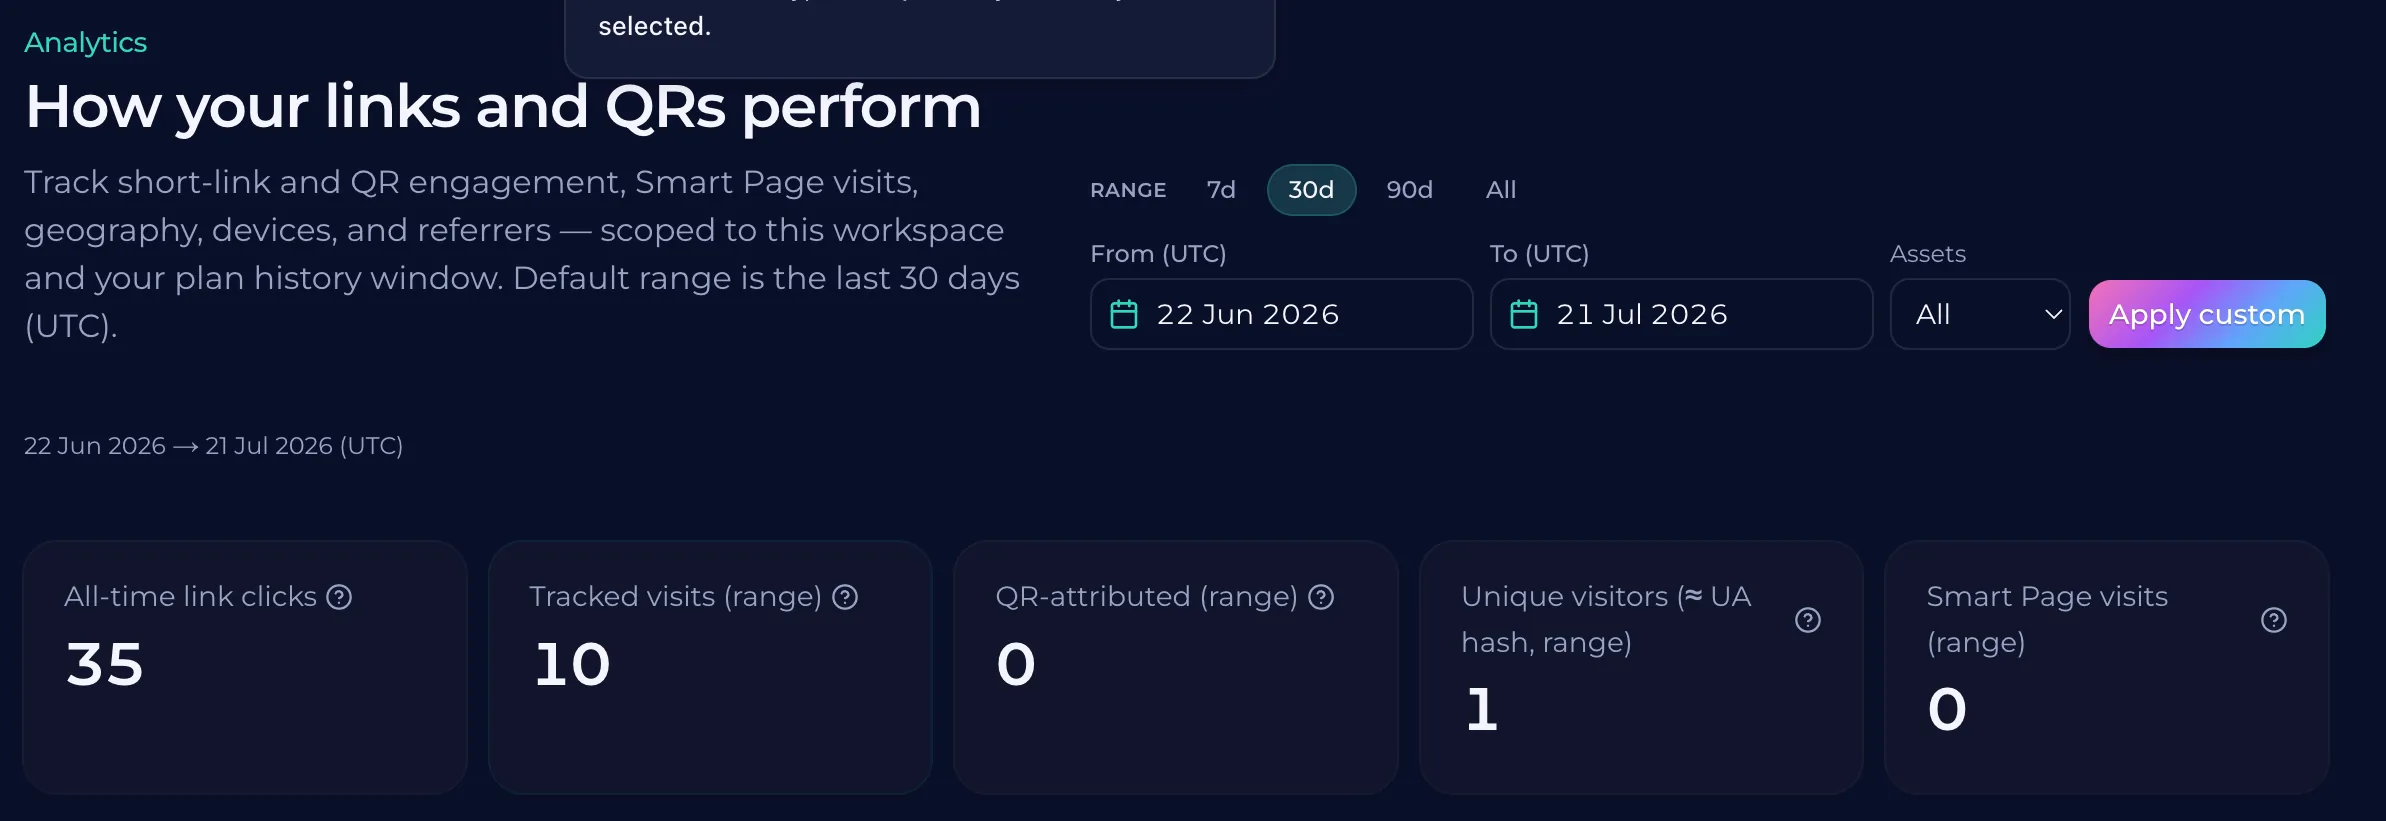
A static QR code is a black box. You scan it and it works, or it fails to reach your target audience. With dynamic codes, you can see exactly how many people are scanning the flyer in real-time. This data tells you which version of the flyer design or offer worked better. When you track scans, you get more than just a count. You see the device type and the rough location of each scan. This helps you identify if your audience is interacting with their phones during specific times or in specific locations. \nBy using dynamic codes for both versions, you can compare the two designs directly. The data provides a sense of direction rather than guesswork. You are no longer guessing whether the scan rate is high enough to feel significant.
Analyzing Results to Make Decisions
Wait for a sufficient number of scans before making changes. A small sample size can lead to false conclusions based on luck or timing. If one flyer is placed in a high-traffic area and the other in a low-traffic spot, the data will skew naturally. You need enough data points to see a clear trend. Look for patterns in the scan volume over time. A sudden spike might indicate a specific event or location. Consistent growth shows steady interest. Compare the two codes to see which one drives more traffic to your goal. The winner is clear when the behavior of users follows a predictable pattern rather than a random jump. Decide on an action based on these results. If one code performs significantly better, shift your resources toward that strategy. You might choose to offer a different incentive or change the copy on the page they land on. Use the data to decide what to do next.
Common questions
- Can I use two different QR codes on a form of printed material?
- You can print two different QR codes on one piece of paper to test different offers or landing pages. However, keep the design and layout consistent between both versions so you only measure the difference in user behavior.
- How many scans do I need before I can see a trend?
- You need at least 30 to 50 scans to begin identifying patterns in device types or locations. With fewer than that, the data is often too noisy to draw reliable conclusions about your audience.
- What is the difference between a static and dynamic QR code for testing?
- A static QR code encodes the link directly into the pattern, meaning it cannot be changed once printed. A dynamic QR code uses a redirect; this allows you to change the destination URL while keeping the same printed code, which is essential for testing different versions of form or landing pages.
- How do I know which landing page is better?
- Compare the conversion rates of both links on your flyer to see which one performs better. Use a unique QR code for each version to track specific data like device type and scan volume over time.
Keep reading
- How to Prove Marketing ROI to a ClientLearn how to provide defensible data for offline marketing and track the specific impact of physical assets like flyers, posters, and signage.
- What a QR code scan actually tells you, and what it does notLearn exactly what data is captured during a QR code scan, including device type and location, and what personal information is never collected.
- QR Codes and UTM Parameters: How They Work TogetherLearn how QR codes bridge the gap between physical and digital marketing while UTM parameters provide specific tracking data for every click.