
How to Prove Marketing ROI to a Client
Learn how to provide defensible data for offline marketing and track the specific impact of physical assets like flyers, posters, and signage.

How to track offline marketing performance
A printed flyer or a billboard is a black box. A static QR code makes this impossible because it sends every scan to the same destination, making it impossible to distinguish between a scan from a paper menu or a scan from a plain sticker. hought}<channel|>{
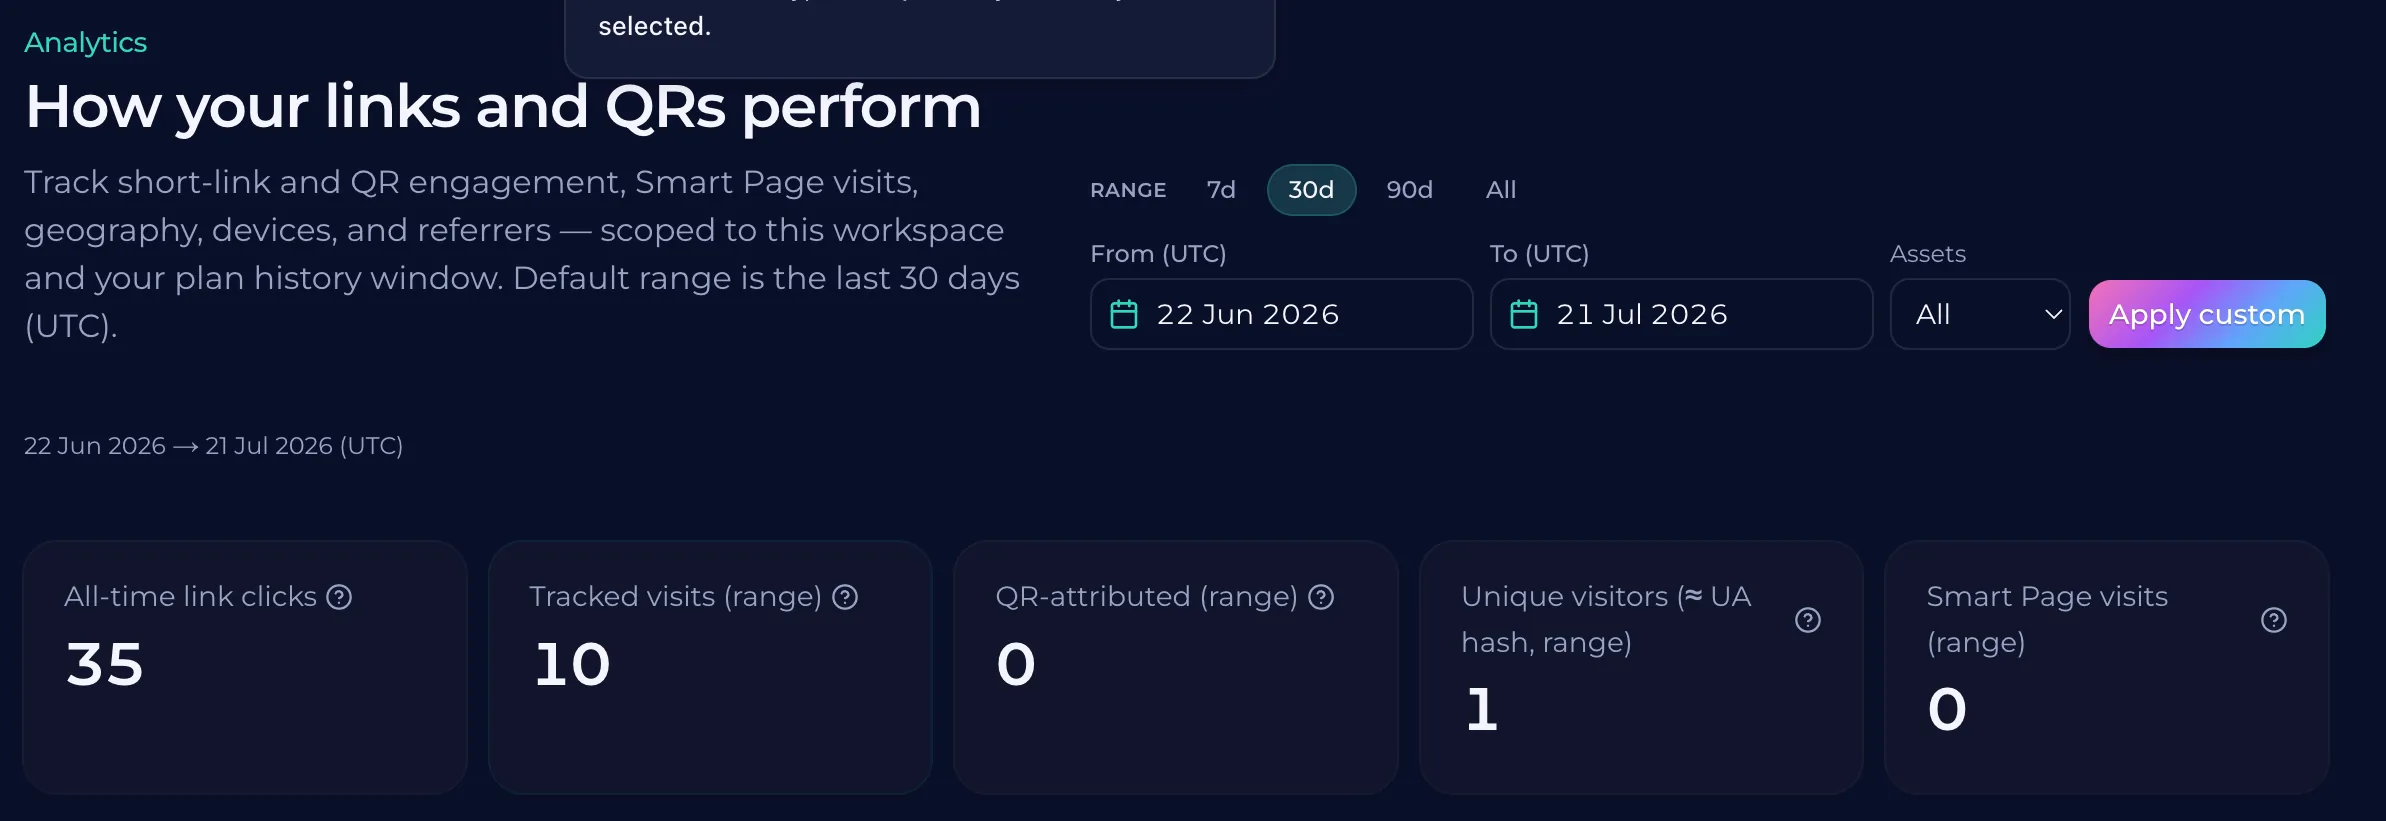
Turning scan data into actionable ROI metrics
Raw scan data from a QR code provides the foundation for your report. Instead of just showing a total count, break the data down by device type and time of day. This helps you identify which audience segments are engaging with the physical materials. If a high volume of scans occurs on mobile devices during a specific window, you can correlate that activity with a specific event or time-bound promotion. hought}The raw scan data from a QR code provides the foundation for your report. Instead of just showing a total count, like a black box, you can break the data down by device type and time of day. This helps you identify which audience segments are engaging with the physical materials. If a high volume of scans occurs on mobile devices during a specific window, you can correlate that activity with a specific promotion. When you present these numbers to a client, frame them as engagement milestones. A scan is a successful transition from a physical touchpoint to a digital action. You can show how many people took the step to interact with the brand. This moves the conversation from "how many people saw the flyer" to "how many people took action." Connect these metrics to the client's specific goals. If the goal is brand awareness, the scan count is a direct measure of interest. If the goal is a lead generation campaign, the scan count represents the top of the funnel. By categorizing these actions, you provide the client with a clear picture of how the physical marketing and digital engagement are working together.
Comparing offline results with onlineer metrics
Clients often struggle to see the connection between a physical flyer and a digital sale. You can bridge this gap by mapping scan data to the specific campaigns they already understand. When a customer scans a QR code on a billboard, the data shows a direct path from the physical world to a digital action. Clients may also ask how these scans compare to online ads. You can explain that while a digital ad has a click-through rate, a physical scan is a high-intent action. A scan is not just a click; it is a deliberate choice to engage with the content. This distinction helps the client see the value of offline channels. Present the scan data alongside their existing digital metrics. By showing that a scan is a high-intent action, you can demonstrate how offline marketing works in tandem with the other channels. This allows the client to feel confident that the offline campaign is running successfully.
Choosing the right tracking method for each channel
A billboard or a flyer is a black box. A QR code provides a measurable bridge between a physical space and a digital action. Instead of guessing how many people saw a sign, you can show the client exactly how many people scanned the code and what device they used. This turns a vague impression into a concrete action. Different channels require different tracking logic. A local shop might use a unique QR code for their storefront window, while a billboard campaign uses a different code. By assigning unique codes to each location, you can isolate the specific performance of each asset. This allows you to report on the exact location where the offer was accepted, rather than just the sum of total scans. When presenting to a client, focus on the data that directly correlates to the user's journey. If a client is worried about a scan, you can show them the volume of scans over time. This helps them see the patterns of engagement. You can then explain how these scans represent a transition from a physical space to a digital one, providing a clear path of intent.
Presenting the data to your client
Clients want to see the direct connection between a physical touchpoint and a digital action. Instead of showing raw scan counts, frame the data as a bridge between the two worlds. Explain how a scan represents a specific moment of intent. A person saw the flyer, picked up their phone, and chose to engage with the brand. This narrative turns a simple number into a measurable action. When presenting, group scan data by device type or time of mention. This helps the client see patterns in how people interact with the campaign. If a specific location or time of day shows a high volume of scans, it highlights where the audience is most active. This context makes the data useful for future planning rather than just a reporting metric. Focus on the delta between a scan and a conversion. A scan is the first step in a funnel. Show the client how many scans led to a user landing on a specific page or completing a goal. By highlighting this progression, you show that the marketing spend was not a burden but a direct path to a customer. Use the clear, distinct data from QURL to back up these claims.
Common questions
- How do I track the ROI of a physical flyer?
- To track the ROI of a physical flyer, you must connect the physical action to a digital record. A unique QR code on the flyer allows you to see exactly how many people scanned the code, what device they used, and when they scanned it. This data helps you identify which specific locations or designs are working, allowing you to report clear numbers to your client.
- What metrics should are important for as-syndicated offline marketing?
- To prove ROI, focus on metrics that connect offline actions to online results. Track scan volume, peak usage times, and device types to identify which physical locations or timeframes are driving the most engagement. These data points allow you to show clients exactly where and when their offline campaign is performing.
- How do I prove the value of work done for offline marketing?
- To prove the value of offline marketing, you must connect physical touchpoints to digital actions. Use dynamic QR codes to track specific metrics like scan volume, device types, and location data, allowing you to present a clear report of how many people interacted with the link from a physical sign or flyer.
- What is the most effective way to turn a scan into a lead?
- To turn a scan into a lead, place a clear call to action on the landing page where the user lands. Ensure the purpose of the page is singular and focused, so the user doesn't have to guess what to happen next.
Keep reading
- What a QR code scan actually tells you, and what it does notLearn exactly what data is captured during a QR code scan, including device type and location, and what personal information is never collected.
- QR Codes and UTM Parameters: How They Work TogetherLearn how QR codes bridge the gap between physical and digital marketing while UTM parameters provide specific tracking data for every click.
- How to A/B Test Printed Flyers with Two QR CodesLearn how to split a print run and use two different QR codes to compare offer types or landing pages. This guide covers testing methodology, sample sizes, and data analysis.